Going further
Job management
Here are the most common commands to interact with Slurm:
Command |
Role |
OAR command |
|---|---|---|
Information about nodes and partitions |
oarnodes |
|
Information about running jobs |
oarstat |
|
View Slurm state (jobs, nodes, partitions, …) |
||
Run interactive sessions |
oarsub -I |
|
Run parallel jobs |
oarsub |
|
Submit batch script jobs |
oarsub -S |
Full documentation for the most recent version can be found here.
sinfo
By default, sinfo lists the partitions available and their
current usage.
$ sinfo
PARTITION   AVAIL  TIMELIMIT  NODES  STATE NODELIST
cpu_homogen    up 7-00:00:00     20   idle node[001-020]
cpu_devel*     up 7-00:00:00      1    mix node021
cpu_devel*     up 7-00:00:00      7   idle node[022-028]
gpu            up 1-00:00:00      1   idle gpu001
In this example, you can see three different partitions, cpu_homogen, cpu_devel (default, marked with ‘*’) and gpu. For those who have used OAR scheduler, partitions are the equivalent of queues. node021 has jobs running but still has available resources (mixed state). Other nodes are in idle state, waiting for work.
sinfo command also display the TIMELIMIT column, pointing the maximum
duration of a job on the corresponsding partition.
A more node oriented use of the sinfo command is:
$ sinfo -l -N -n node00[1-2]
Thu May 14 13:13:54 2020
NODELIST   NODES   PARTITION       STATE CPUS    S:C:T MEMORY TMP_DISK WEIGHT AVAIL_FE REASON
node001        1 cpu_homogen        idle   64   2:16:2 191839        0      1   (null) none
node002        1 cpu_homogen        idle   64   2:16:2 191839        0      1   (null) none
which displays detailed information about a set of nodes. The --format
option can be used to specify more precisely the desired information. Check
man sinfo for more details.
squeue
squeue command displays the list of jobs in Slurm queue. Combined with the
parameters -l -u you can view information concerning only your own jobs:
e.g.: squeue -l -u $USER.
$ squeue -l -u slegrand
         JOBID PARTITION     NAME     USER ST       TIME  NODES NODELIST(REASON)
          1353 cpu_devel     bash slegrand  R       0:46      1 node021
The R in the STATUS column shows that the job status is running. The most
common status you will encounter are R running, PD pending and F failed.
You can use the squeue command to get a job ID and cancel it with the
command scancel <jobID>.
scontrol
The scontrol show job command completes the squeue command. It allows users to get
precise information about there running jobs.
# Get jobid
$ squeue -l -u <login>
$ scontrol show job 1759
JobId=1759 JobName=bash
UserId=slegrand(650632) GroupId=mokaplan(21117) MCS_label=N/A
Priority=4294901539 Nice=0 Account=(null) QOS=normal
JobState=RUNNING Reason=None Dependency=(null)
Requeue=1 Restarts=0 BatchFlag=0 Reboot=0 ExitCode=0:0
RunTime=00:00:49 TimeLimit=7-00:00:00 TimeMin=N/A
SubmitTime=2020-06-10T17:26:12 EligibleTime=2020-06-10T17:26:12
AccrueTime=Unknown
StartTime=2020-06-10T17:26:12 EndTime=2020-06-17T17:26:12 Deadline=N/A
PreemptTime=None SuspendTime=None SecsPreSuspend=0
LastSchedEval=2020-06-10T17:26:12
Partition=cpu_homogen AllocNode:Sid=cleps:236911
ReqNodeList=(null) ExcNodeList=(null)
NodeList=node[001-004]
BatchHost=node001
NumNodes=4 NumCPUs=40 NumTasks=40 CPUs/Task=1 ReqB:S:C:T=0:0:*:*
TRES=cpu=40,node=4,billing=40
Socks/Node=* NtasksPerN:B:S:C=0:0:*:* CoreSpec=*
MinCPUsNode=1 MinMemoryNode=0 MinTmpDiskNode=0
Features=(null) DelayBoot=00:00:00
OverSubscribe=OK Contiguous=0 Licenses=(null) Network=(null)
Command=bash
WorkDir=/home/slegrand/tmp/cleps-examples/threads_mpi
Power=
scontrol command allows more than job description. Check the complete
documentation
for more information.
salloc
The salloc command can be used to submit an interactive job inside of which
you can run srun.
salloc -c 4
Will allocated four cpus on a node and start a shell. Interactive jobs must be your prefered way to do every development tasks, including code compilation.
srun
The srun command allows you to submit jobs on CLEPS nodes. You can use
this command to directly submit a job (no script).
Example:
You have a MPI program that you compiled with openmpi3 (implies the use of
--mpi=pmix option). You want to run it on 2 nodes with 4 tasks on each
node:
srun --mpi=pmix -N 2 --ntasks-per-node=4 ./my_mpi_exec
Warning
In Slurm terminology, a cpu can either be a physical core (no hyperthreading),
or a logical core (hyperthreading). If you want to allocate one thread per core
on a hyperthreaded node, you can use the option --hint=nomultithread.
Here is a link toward SLURM srun documentation.
sbatch
The sbatch command allows you to submit a batch script to Slurm. For those
who have used the RIOC cluster, it is the equivalent of the OAR scheduler’s
oarsub -S command.
A batch script contain two types of information:
“SBATCH” instructions, used by sbatch to transfer information to Slurm about your job. Warning: These directives MUST appear between the shebang (#!/usr/bash or #!/usr/bin/env python, …), and the first executable command.
Executable commands
The signature of the sbatch command is the following:
sbatch [OPTIONS(0)...] [ : [OPTIONS(N)...]] script(0) [args(0)...]
Note that options affect Slurm (ex: --nodes) and args affect your script.
Here is an example where you ask for 4 nodes, with 12 tasks per node and 10GB per node, for an hour:
#!/bin/bash

# Lines that begin with #SBATCH specify commands to be used by SLURM for scheduling

#SBATCH -J job_name
#SBATCH --time=01:00:00
#SBATCH --nodes=4
#SBATCH --ntasks-per-node=12
#SBATCH --mem=10gb

module purge
module load gnu8 openmpi3

mpirun ./my_exec param1 ...
Warning
For MPI users, be careful to load the same module as you used to compile your code. Furthermore, depending on the MPI flavour you use, the command used to launch your might differ. For more info, please refer to the SLURM MPI documentation.
Interactive job monitoring
If you want to monitor a running job by connecting to one your allocated resources, you
can use the --overlap option of srun.
srun --jobid <running_jobid> [-w <node_name>] --overlap --pty bash
A node name can be specified in case of a multiple nodes allocation. This will not allocate anything new, but only start a new step on already allocated resources.
Processes mapping
To find where processes are mapped, you can use the --cpu-bind=verbose
option of the srun command.
$ srun -N 1 -n 2 -c 1 --ntasks-per-socket=1 --cpu-bind=verbose  ...
...
cpu-bind=MASK - node053, task  1  1 [20808]: mask 0x2 set
cpu-bind=MASK - node053, task  0  0 [20807]: mask 0x100000000 set
...
In this example, we launched two tasks on a single node, each of them using one cpu on a different socket. We can see from the output that the tasks have been run on node053, and we can retrieve from the mask, the cpus set (in hexadecimal) they were mapped on. Converted in binary, this mask is a bitmask, with the lowest order bit corresponding to the first logical CPU and the highest order bit corresponding to the last logical CPU.
Task |
Mask |
Bitmask |
Cpus ID |
|---|---|---|---|
0 |
0x2 |
10 |
1 |
1 |
0x100000000 |
000100000000000000000000000000000000 |
32 |
The command lscpu on node053 confirms that those two task were executed
on a different socket (~NUMA node):
$ lscpu
...
NUMA node0 CPU(s):     0,2,4,6,8,10,12,14,16,18,20,22,24,26,28,30,32,34
NUMA node1 CPU(s):     1,3,5,7,9,11,13,15,17,19,21,23,25,27,29,31,33,35
...
A useful file to consult when playing with process mapping is /proc/self/status.
It contains many information about the current process, especially about its set
of cpus.
$ srun -N 1 -n 2 -c 1 --cpu-bind=verbose --ntasks-per-socket=1 grep Cpus_allowed_list /proc/self/status
...
cpu-bind=MASK - node053, task  1  1 [32114]: mask 0x2 set
cpu-bind=MASK - node053, task  0  0 [32113]: mask 0x100000000 set
Cpus_allowed_list:  1
Cpus_allowed_list:  32

The same example as before confirms the correctness of the information
provided by the ``--cpu-bind=verbose`` option.
OAR/Slurm transition
Command |
Slurm |
OAR |
|---|---|---|
Submit an interactive job |
srun –pty bash |
oarsub -I |
Submit a passive/batch job |
sbatch <script> |
oarsub -S <script> |
Get user jobs status |
squeue -u <user> |
oarstat -u <user> |
Get specific job status |
scontrol show job <jobid> |
oarstat -f -j <jobid> |
Delete job |
scancel <jobid> |
oardel <jobid> |
Specifications |
Slurm |
OAR |
|---|---|---|
Directives |
#SBATCH |
#OAR |
Number of nodes |
-N <num_nodes> |
-l nodes=<num_nodes> |
number of core per node |
-c <core_per_node> |
-l core=<core_per_node> |
Lustre filesystem
The Lustre filesystem is a parallel filesystem and thereby designed to support large-file parallel IO.
The main feature leading to high performance for this filesystem is its ability to stripe data across multiple storage targets (OSTs). This means that you can split your files into chunks that will be stored on different OSTs. This striping process allows mainly two different things:
Sharing disk usage between different physical resources.
Accessing portions of files located on different OSTs at the same time, resulting in an increased bandwidth.
Architecture
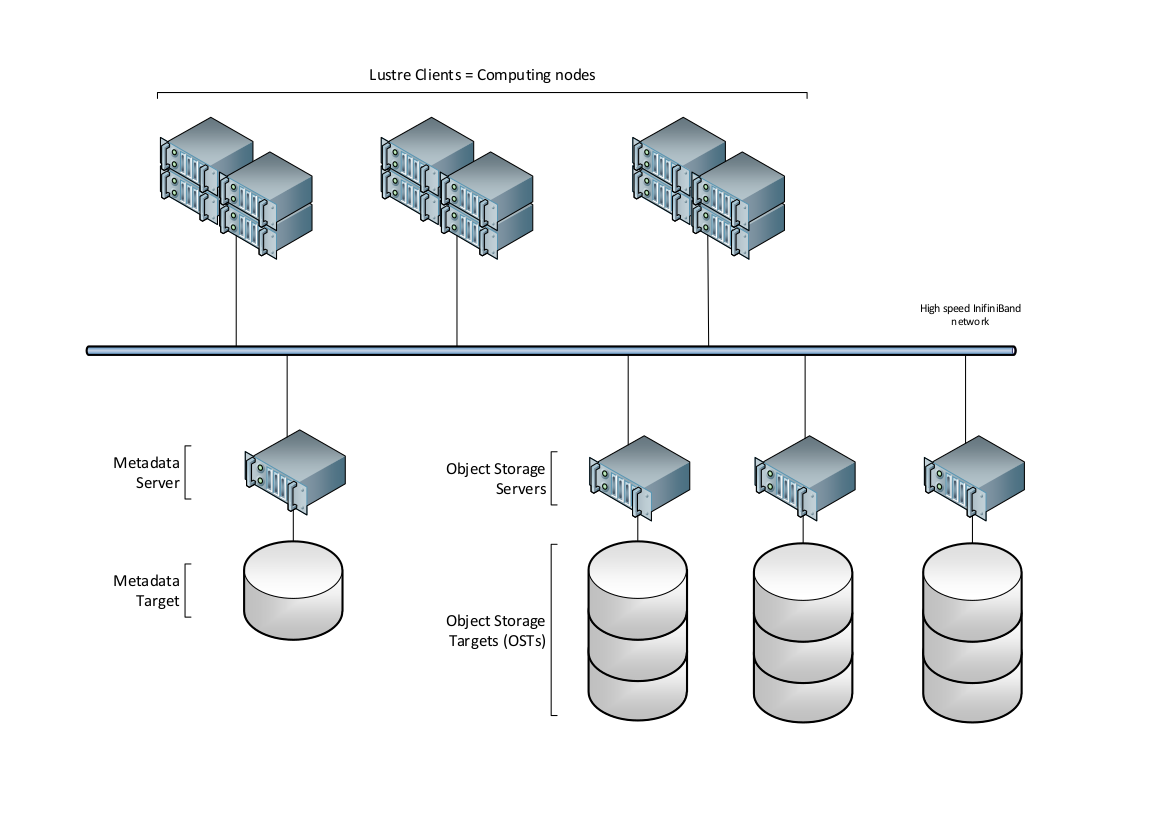
As you can see on the above picture, Lustre separates the data from the metadata. The metadata, which hold information such as data location, size of the data, permissions, …, are stored on a Metadata Server (MDS). Data are stored on set of disks called Object Storage Targets (OSTs), which are managed by Object Storage Servers (OSSs). At the time of these lines, CLEPS Lustre filesystem includes 3 OSSs and a total of 15 14TiB OSTs.
File striping
As explained above, Lustre has the ability to split files into chunks of data (stripes). For a given file, the way these chunks are distributed over the OSTs is called the file’s layout or striping.
The default striping on /scratch uses a feature called Progressive File
Layout. It means that the striping will change according to the file size.
File size |
0 - 512MiB |
512MiB - 40GiB |
More than 40GiB |
|---|---|---|---|
stripe_count |
1 |
4 |
Number of available OSTs |
stripe_size |
1MiB |
4MiB |
64MiB |
This striping is set on the /scratch folder and inherited by any subdirectories.
It should provide close to optimal performance in most use case. Nevertheless
you can overwrite this default setting and set you own striping on a file
or directory with the lfs setstripe command:
lfs setstripe [--size|-s stripe_size] [--count|-c stripe_cnt]
                          [--index|-i|--offset|-o start_ost_index]
                          [--pool|-p <pool>] ...
                          <dirname|filename>
Parameter |
Description |
|---|---|
-S stripe_size |
Number of bytes to store on an OST before moving to the next OST. A stripe_size of 0 uses the file system’s default stripe size, (default is 1 MB). Can be specified with k (KB), m (MB), or g (GB). |
-c stripe_count |
Number of OSTs over which to stripe a file |
-i start_ost_index |
OST index (starting at 0) on which to start striping of the file. Default is -1, let the MDS choose (recommended) |
Examples:
# Create a file with default layout of the directory
touch testfile

# Create a default layout for all files in directory
lfs setstripe -c 4 -S 1M

# Create a file striped on two OSTs
lfs setstripe -c 2 -S 4M testfile2

# Create a file on a single OST
lfs setstripe -c 1 2M testfile3
In the last example, testfile3 is striped over a single OST and will be written by chunks of 2MiB. You’ll notice that the file size isn’t known at creation time, lfs setstripe only set the layout of the file.
The lfs getstripe command lists striping information of a file or directory:
lfs getstripe [--quiet|-q] [--verbose|-v]
              [--count|-c] [--index|-i | --offset|-o]
              [--size|-s] [--pool|-p] [--directory|-d]
              [--recursive|-r]  ...
              <dirname|filename>
Parameter |
Description |
|---|---|
-q |
Allocation information, not layout |
-c |
List OSTs index |
-s |
Stripe size (how much data is written on one OST before moving to the next) |
-p |
List the pools to which a file belongs |
-d |
Print layout information of files in a directory |
-r |
Recurse into all subdirectories |
Stripe alignment
If you want to benefit striping with parallel accesses to a file, you need to ensure that the different processes of your program read/write part of a file located on different OSTS. This will prevent concurrent accesses and ensure optimal performance.
You can find more information about stripe alignment [here](https://www.nics.utk.edu/computing-resources/file-systems/io-lustre-tips#stripe-alignment).
External documentation
For those who are interested in more details about how to manage file striping, here are some useful links:
Nasa Lustre filesytem documentation and especially the best practices part.